Automated Network Monitoring by LogicMonitor
Monitor the health and performance of your entire network infrastructure on a single, unified platform. With NetDescribe and LogicMonitor.
“With the clear visualizations and custom dashboards, you’ll understand your network better than ever before!”
Stefan Stettin | LogicMonitor Expert at NetDescribe

The Challenge
In today’s fast-moving and highly dynamic technology landscape, companies rely on robust digital infrastructures. The challenges they face make choosing and integrating a monitoring tool a strategic decision.
- Complex IT infrastructures: The increasing interconnection of on-premises, cloud, and hybrid environments makes it difficult to fully monitor and manage all systems and devices.
- Multi-vendor & multi-technology support: Ops teams must support a wide range of technologies and platforms from different vendors. Fast and flexible integration is essential.
- Lack of transparency and insights: Without a centralized platform, it’s hard to gain a complete overview of the performance and health of all IT components, slowing down issue detection and resolution.
- Reactive rather than proactive troubleshooting: Companies often deal with problems after they occur, which consumes time and resources, instead of detecting and preventing issues early.
- High operational costs and limited resources: Managing and maintaining monitoring tools can be costly and labor-intensive, especially when multiple, poorly integrated solutions are in use.
- Few individual know-how carriers: Open-source or in-house monitoring solutions are often maintained by a small group of specialists. If those experts are unavailable, the entire process can come to a standstill.

LogicMonitor – the Solution from NetDescribe
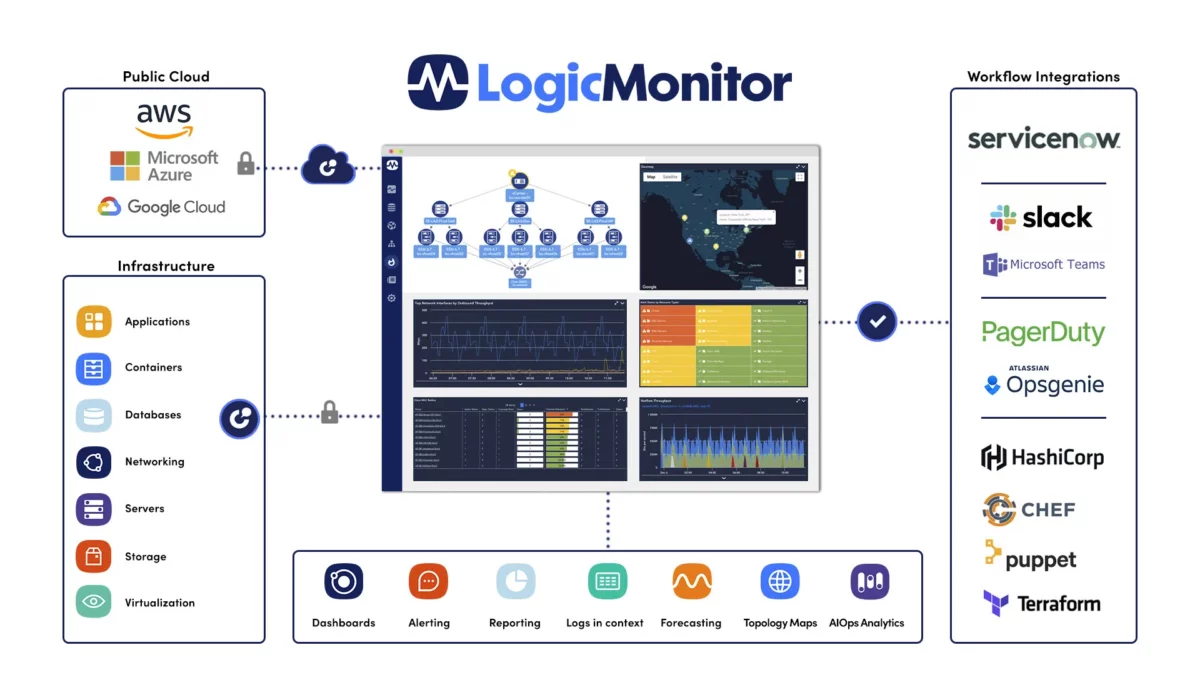
LogicMonitor is a cloud-based platform for IT infrastructure monitoring that helps companies monitor their networks, servers, cloud environments, and applications in real time. The platform provides deep insights and powerful analytics to optimize performance and availability, and to proactively detect and resolve issues. With customizable dashboards and automated alerts, LogicMonitor helps ensure the efficiency and reliability of your IT environment, allowing your teams to spend less time monitoring and more time driving innovation.
Automated network monitoring for hybrid enterprise IT environments, combined with optimized cloud monitoring, delivers comprehensive visibility across your entire infrastructure. With LogicMonitor, you can easily map your networks to gain a complete overview.
Source: www.logicmonitor.com
LogicMonitor is built for rapid deployment and integrates seamlessly with your existing infrastructure. It captures telemetry data and provides full transparency across multi-cloud environments, diverse infrastructures, applications, and business services. Through AI-driven analytics, the platform automatically detects anomalies and trends, analyzes thousands of events, and delivers the insights you need to quickly identify and resolve issues when every minute matters.
A Unified Environment
- A single, consolidated view across multiple clouds and on-premises systems
- Seamless monitoring and troubleshooting
- Shared dashboards, alerts, and insights
- Service-level insights for visualizing business impact
Multi-Level, Intelligent AI-Driven Analytics
- Predictive analysis and dynamic thresholds
- Correlated alerts and actionable insights
- AI-based anomaly detection and trend recognition
Hybrid Observability
LogicMonitor offers seamless integration with over 2,500 technologies. Thousands of ready-to-use integrations with top vendors like Cisco, Juniper, Meraki, and more enable automatic, agentless discovery of every device across your entire network – effortlessly.
- Monitor your networks via SNMP, SysLog, API, jFlow, NetFlow, sFlow, WMI, NBAR2, and/or IPFIX.
- Gain visibility into firewalls, routers, switches, wireless devices, load balancers, and more.
- Enjoy comprehensive monitoring for cloud-based networks, including SD-WAN.
Infrastructure Monitoring – Comprehensive infrastructure monitoring with contextual insight into your constantly expanding and dynamic IT landscape. Predictive insights into your cloud, on-premises, and hybrid environments, along with intelligent troubleshooting tailored to your needs.
- Network Monitoring
- Server Monitoring
- Remote Monitoring
- Virtual Machine Monitoring
- Database Monitoring
- Storage Monitoring
- Configuration Monitoring
Cloud Monitoring – Monitor as you modernize with unified hybrid multi-cloud observability that scales effortlessly across your complex ecosystem. Maximize your cloud investments in AWS, Azure, and GCP with real-time visibility into the health and performance of every deployment.
- Container Monitoring
- AWS Monitoring
- GCP Monitoring
- Azure Monitoring
Digital Experience – User experience plays a critical role in the success of any digital platform. An Application Performance Monitoring (APM) solution tracks the performance of key application components such as servers, databases, and services. When it comes to understanding the end-user experience, Digital Experience Monitoring (DEM) is essential for uncovering how users (people, machines, or digital devices) interact with their digital platforms.
- APM
- SaaS Monitoring
- Website Monitoring
LogicMonitor API and Workflows – Seamless Integration
With LogicMonitor’s API, you can eliminate the need for manually onboarding individual devices and their operational attributes. Use the LogicMonitor API to automate the onboarding process for an entire site within just a few minutes using a data source (e.g. CMDB).
You can also integrate LogicMonitor with third-party IT service management (ITSM) solutions to create a seamless connection between both platforms.
Examples of workflow solutions that can be integrated with LogicMonitor include:
- Datto’s Autotask Professional Services (PSA)
- ConnectWise
- Atlassian’s Jira Service Management
- PagerDuty’s Incident Response
- ServiceNow’s Configuration Management Database (CMDB)
- ServiceNow’s Incident Management
- ServiceNow’s Service Graph Connector
By integrating LogicMonitor with a workflow solution, bidirectional communication can be established. This enables LogicMonitor to manage the incident management workflow based on alert status and allows selected ITSM solutions to acknowledge alerts depending on the incident status. For example, as an alert moves through the escalation chain, LogicMonitor communicates with your ITSM solution to create, update, and close incidents.
In addition, you can acknowledge alerts in some solutions based on the incident’s current status.
Source: www.logicmonitor.com
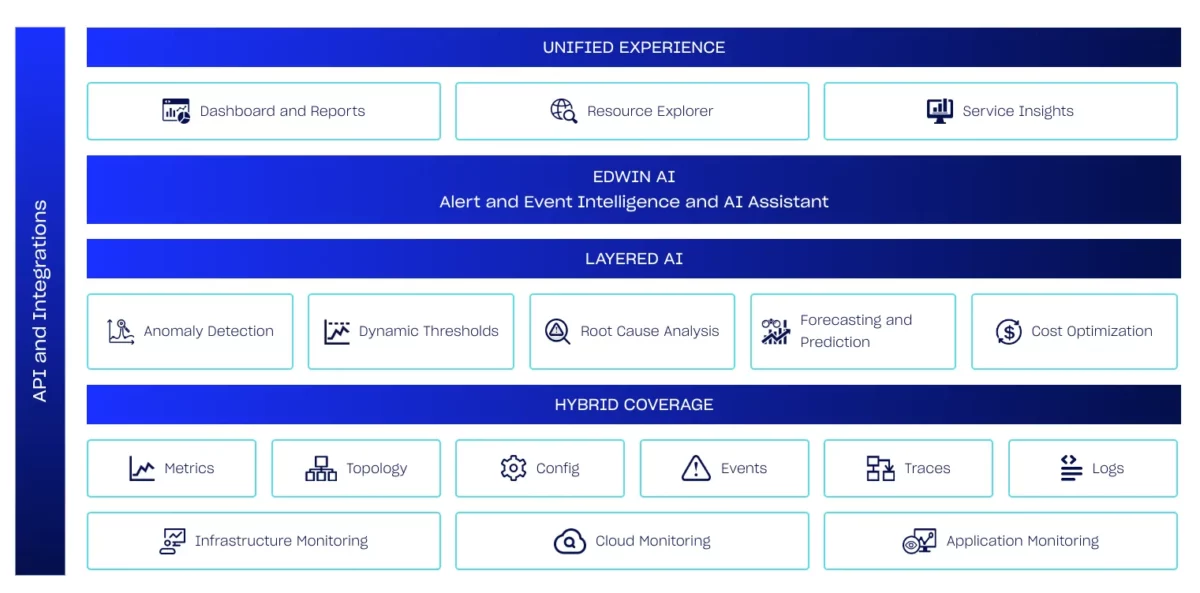
Edwin AI – Your new teammate
Meet Edwin AI! LogicMonitor’s innovative generative AI solution, designed to be an indispensable partner for ITOps teams.
Edwin AI revolutionizes cross-functional incident management. Using machine learning and intelligent automation, Edwin AI accelerates the detection, analysis, and resolution of issues.
It optimizes cross-functional support workflows by merging and processing relevant data in real time to deliver instantly actionable insights. IT teams can respond to disruptions faster and more accurately, minimize downtime, and improve the efficiency of the entire IT ecosystem. By leveraging Edwin AI, companies can manage the complexity of modern digital infrastructures and meet the ever-growing demands for performance and availability.
Immediate Results
- Extremely short time-to-value
- Deployment in less than a day with no extensive training required
- Instant real-time summaries and autocorrelation
- Fast ticket routing
- Prevents escalation delays
Supercharging Level-One and Level-Two Support
- The GenAI assistant scales IT operations exponentially
- Proactive operation replaces reactive “firefighting”
- Customizable machine learning models
- Tailored insight reports for specific business requirements
Enabling Cross-Functional Collaboration
- Consolidates support workflows across ITOps, SecOps, DevOps, and other teams
- Accelerating cross-functional incident resolution
- Correlates related alerts into single ticket
- Enables quick problem resolution or seamless handoff to responsible teams
Edwin AI stops the constant noise of alerts!
- Helps teams focus on what truly matters
- Compresses up to 97% of alert volume
- Reduces alerts and improves focus
- Ensures that critical issues are never missed
- Identifies causal alerts and patterns
- Uses automatically generated tags and timelines to detect recurring patterns
Business Benefits
The LogicMonitor platform helps companies optimize their IT operations, increase efficiency, and reduce costs.
Easy onboarding: Fast and seamless integration with existing cloud services and applications enables rapid time-to-value.
Real-time insights and proactive management: Real-time data and analytics make proactive management possible and ensure a quick response to potential issues.
User-friendliness for IT teams: The intuitive interface simplifies daily operations and minimizes training requirements for IT staff.
Reduced time and effort: The platform reduces the time and effort needed to set up and customize monitoring, resulting in cost savings and more efficient resource utilization.
Effective prediction and reduction of downtimes: With advanced monitoring and analytics tools, downtime can be anticipated and minimized, increasing the reliability of the IT infrastructure.
Support for multi-layer IT infrastructures: LogicMonitor provides a comprehensive solution for monitoring both traditional data centers and public cloud environments, enabling unified management.
Replacement of outdated legacy monitoring tools: Outdated and inefficient monitoring tools can easily be replaced with LogicMonitor, modernizing and simplifying the monitoring environment.
Scalability and flexibility: The platform is scalable and adaptable, allowing companies to tailor it to their specific requirements and expanding IT environments.
Centralized monitoring and management: A single dashboard enables centralized monitoring and management of all IT resources, which improves efficiency and visibility.
Enhanced operational efficiency: The consolidated platform not only saves time and costs but also optimizes resource allocation and utilization within the IT department.
Improved decision-making: With deep insights and analytics, IT and business leaders can make more informed decisions that drive performance and support business objectives.
Service and Support: Automated integration of LogicMonitor into your existing IT landscape (e.g., CMDB) combined with professional support directly via the platform and German consulting expertise from NetDescribe. With NetDescribe’s consulting and integration assistance, you can ensure your operating processes efficiently and independently of your own resources.
Downloads and Links
Gartner® Market Guide for Infrastructure Monitoring Tools
Book your personal consultation now
Put your IT performance to the test now. What requirement have you always been looking for a solution for? NetDescribe will get you to your goal – through independent advice, reliable support and proven use cases.
Blog
Interesting Facts from the IT World
-
Combined Splunk expertise within the Xantaro Group: greater transparency, security, and efficiency for our customers
NetDescribe and anykey are pooling their Splunk expertise within the Xantaro Group. Customers benefit from greater transparency, security, and efficient observability and SIEM solutions from…
-
NetDescribe Use Case – Visibility with Splunk IT Service Intelligence
Splunk IT Service Intelligence (ITSI) provides a comprehensive view of the status of your IT services—from infrastructure to business processes. KPI monitoring, machine learning, and…
-
Xantaro Group integrates specialists for technically sophisticated IT infrastructure solutions anykey GmbH
anykey GmbH, an IT system house founded in 1999 and based in Troisdorf, is now part of the Xantaro Group. With this step, the two…