Our Use Case PDFs and blog images are only available in German. If you are interested in further information, we are happy to assist you personally. Please don’t hesitate to contact us directly.
Download the PDF here: Visibility with Splunk IT Service Intelligence
1. The Initial Situation
In our use case, we examine the status of central logging and the challenges of root cause analysis.
Our customer is tasked with providing powerful, future-oriented e-government applications and central infrastructures for operating IT systems for administration and courts.
A central logging infrastructure has been successfully implemented with Splunk Enterprise in the existing IT operation. All relevant components that contribute to the central customer use case—the provision of web services—deliver their log data to this platform. These include operating system logs (Windows, Linux), web server logs (Apache, IIS, NGINX), network logs (firewall, proxy), database logs (e.g., SQL Server), and application logs (Exchange, Active Directory, customer-specific applications).
This comprehensive database essentially offers the possibility of performing root cause analyses in the event of system malfunctions or incidents. However, investigating the causes is often time-consuming and complex, as a deep understanding of technical hierarchies, system relationships, and operational processes is required to correctly correlate and interpret the log data.
A recurring problem is the reactivity of error detection: malfunctions occur regularly that could have been identified in advance using existing log data. Examples include full hard drives or overloaded system components.
Such incidents could be detected and avoided in advance through predictive monitoring or intelligent alerting.
Despite the wide availability of data, there is currently a lack of systematic, proactive evaluation and prioritization of potential risks.
The existing infrastructure is primarily used for downstream error analysis instead of identifying potential vulnerabilities at an early stage.
Optimization toward preventive maintenance and intelligent alerting strategies would be a logical next step toward increasing operational reliability and efficiency.
2. Requirements analysis
The desired solution should significantly simplify and structure the implementation of root cause analyses.
The goal is to enable not only experts, but also 1st and 2nd level support staff to analyze malfunctions independently—without requiring in-depth specialist knowledge of all the applications and services involved.
This requires a solution that supports intuitive visualization, guided analysis steps, and automated correlation of events. In addition, a machine learning-based anomaly detection system is to be integrated that identifies unusual patterns at an early stage and automatically triggers preventive alerts – even before operations are affected.
The result is a system that not only enables reactive troubleshooting, but also makes a decisive contribution to proactivity and stability in IT operations.

Splunk Service Intelligence
Splunk IT Service Intelligence (ITSI) is a powerful monitoring and analysis platform for IT operations based on Splunk technology. ITSI provides a holistic view of the health and performance of IT services by combining real-time data analysis, service correlation, and intelligent alerting.
The solution provides transparent insights into complex IT environments by consolidating technical
metrics, logs, and events related to business-critical services. Using machine learning, ITSI automatically detects anomalies, evaluates service conditions based on defined KPIs (key performance indicators), and prioritizes incidents based on their impact on business operations.
ITSI also supports root cause analysis, reduces mean time to resolution (MTTR), and promotes proactivity in IT operations by providing early warning of potential disruptions. Dashboards, glass cockpits, and predefined use cases enable even less specialized support teams to perform effective monitoring and error analysis.
Overall, Splunk ITSI provides a central, intelligent control platform for optimizing service quality and strengthening operational stability in modern, dynamic IT landscapes.
For more information, see the product brief at Splunk IT Service Intelligence.
3. The Solution
In order to meet the requirements and ensure both transparency and proactivity in IT operations, a suitable technology had to be found.
The Solution from NetDescribe
Using ITSI as a central platform for service-oriented monitoring.
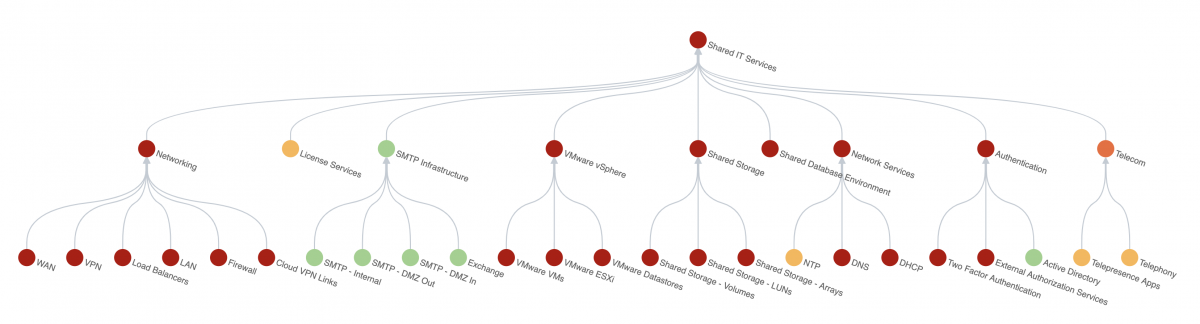
Splunk ITSI offers a powerful solution for comprehensive monitoring and evaluation of IT services using a hierarchically structured service and KPI model that is visualized in so-called glass tables.
At the heart of the solution is the definition and measurement of key performance indicators (KPIs) that reflect the status of individual system components and their impact on higher-level services in real time.
The KPIs are structured hierarchically so that disruptions at lower levels—for example, in a memory module or web server component—can have an impact on the overall view of business-critical services such as Exchange or database platforms.
This structure enables rapid identification of the cause and assessment of the impact on operations.
For many standard services—such as Microsoft Exchange—there are ready-made integrations and KPI sets that enable rapid implementation and high informative value.
In addition, ITSI can be flexibly expanded: In addition to classic operations monitoring, the platform has also been supplemented with security-specific use cases, for example. Security-related KPIs (e.g., SQL injection attempts, cross-site scripting, brute force attacks) are defined, visualized, and integrated into the overall view in order to bring IT security and IT operations together on a common platform.
ITSI thus represents a holistic solution that makes both the technical stability and the security status of IT services transparent and controllable—in a form that is equally understandable for support and management.
Microsoft Exchange Executive Overview Dashboard*
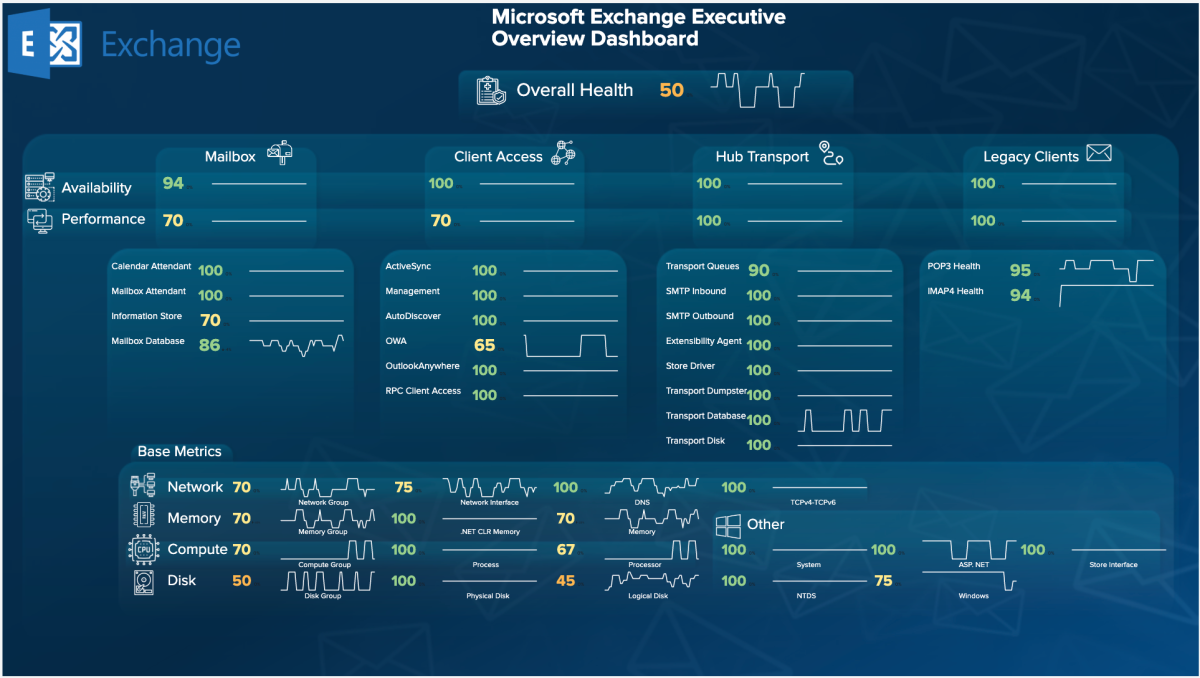
The Microsoft Exchange Executive Overview Dashboard is a glass table within the Content Pack for Microsoft Exchange. It provides key operational metrics, trends, and security overviews in a single view, making it easier for business leaders, CIOs/CTOs, and IT operations to understand the overall health and performance of their Microsoft Exchange services. It includes key metrics and KPIs for four Exchange components: Mailbox, Client Access, Transport, and Legacy.
Splunk ITSI Service Insights enables the creation of four types of dashboards: Infrastructure Overview, Service Analyzer, Deep Dives, and Predictive Analytics.
Infrastructure Overview dashboards provide a consolidated view of all data integrations and investigation tools. Service Analyzer dashboards help visualize dependencies between devices and applications.
Exchange Service Analyzer*
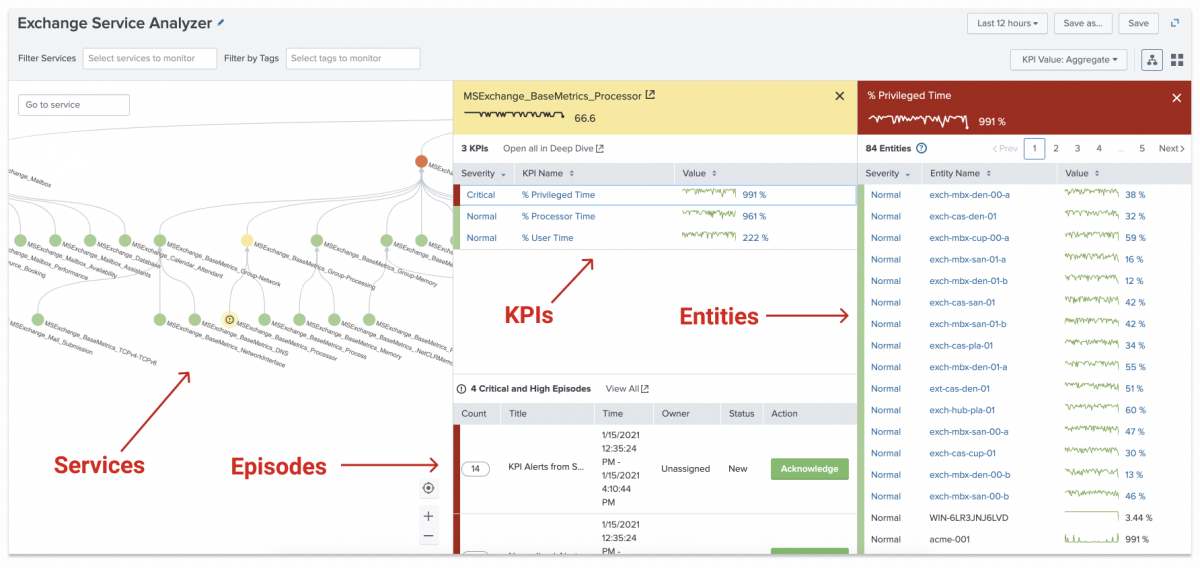
The Exchange Service Analyzer is a preconfigured view in the Content Pack for Microsoft Exchange that provides a visual representation of Microsoft Exchange services and their dependencies. It allows users to see related KPIs, entities, and critical incidents, facilitating root cause analysis and troubleshooting. This feature helps monitor the health and performance of Microsoft Exchange services such as edge and hub transport servers, client access servers, and mailbox storage.
Services Dashboard*
Dashboards*
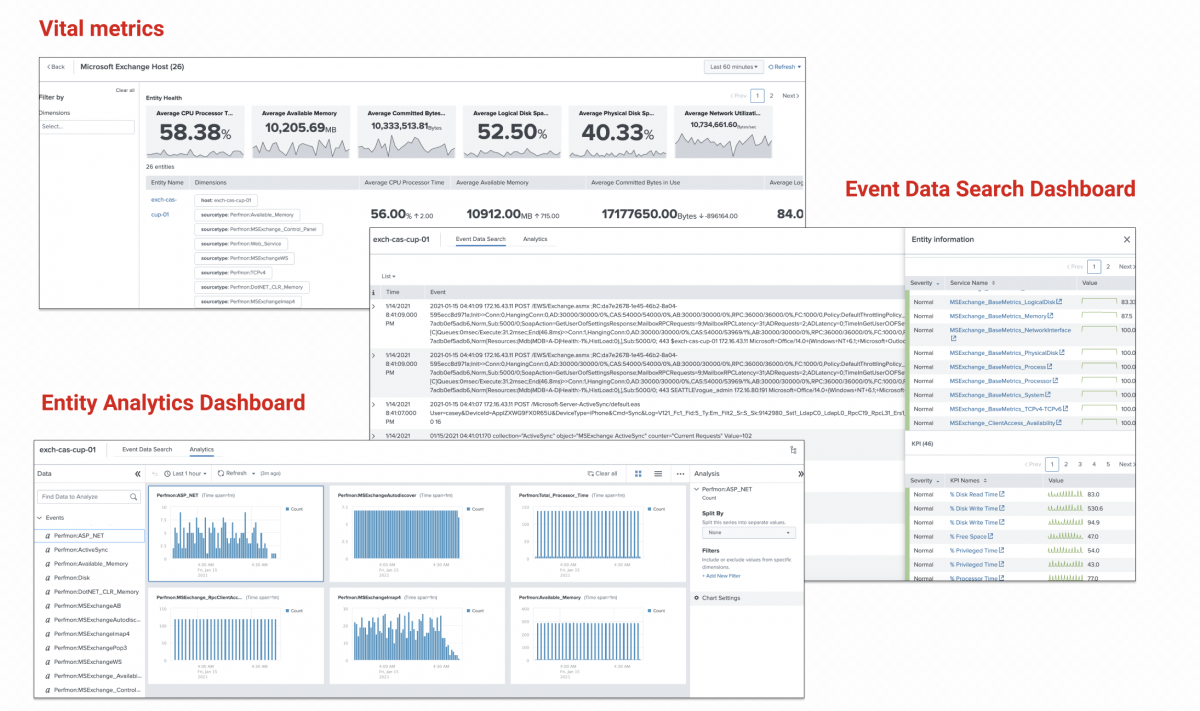
Vital Metrics in Splunk ITSI (IT Service Intelligence) represent statistical calculations based on SPL searches that show the overall health of entities, such as third-party APM entity types, and include metrics such as average uptime, average response time, and average error rate. These metrics can be viewed on the Entity Health page in ITSI.
The Event Data Search dashboard allows users to search and view event data in their organization. To access the Event Data Search dashboard, users must have standard indexes in their role, such as itoa_user, which contains indexes such as itsi_tracked_alerts and itsi_grouped_alerts. Additional indexes can be added to user roles as needed.
The Entity Analytics dashboard allows you to analyze metrics and logs for specific entities in ITSI. You can populate the dashboard with metrics and logs according to the analysis data filters that ITSI associates with a specific entity. This allows for detailed examination of entity performance and health. The dashboard is available for various entity types, including Splunk AppDynamics and Microsoft Exchange entities.
*Source: Splunk
4. Business Benefits
The use of Splunk ITSI has created a transparent view of IT services, including clear dependencies and statuses.
The combination of Glass Tables and the Service Analyzer enables targeted and rapid root cause analysis, even in complex environments, without requiring in-depth expertise across the entire service stack.
Despite the lack of a CMDB, the necessary links between data sources, entities, and KPIs could be mapped automatically using Splunk Lookups and dynamic, scheduled searches. This ensures that KPIs are continuously configured correctly without manual effort.
The anomaly detection feature integrated into ITSI, which is based on machine learning, automatically identifies deviations in system behavior—a decisive advantage when dealing with large volumes of events.
In addition, the machine learning toolkit enables proactive capacity planning, e.g., by predicting hard disk usage, which allows for early alerts and risk-based measures.
Overall, this leads to greater operational reliability, shorter response times, and a significant reduction in the workload of the operational IT team.
The Splunk Portfolio
Splunk platform. Splunk Enterprise collects and indexes in real time all machine data generated in physical, virtual, or cloud environments. This can include data from applications, servers, networks, sensors, or telecommunications equipment. The solution correlates complex events, enables meaningful insights into machine data and simplifies analyses.
Splunk for security. Splunk Enterprise Security improves all security processes and, as an analysis-driven SIEM (Security Information and Event Management) solution, gives you the holistic view to securely use generated machine data (e.g. information about networks, endpoints, accesses, vulnerabilities and identity data) and to reduce security breaches.
Splunk for IT and Business Services.
>Splunk IT Service Intelligence (ITSI) visualizes status data and key performance indicators (KPIs) of critical IT and business services as a monitoring and analysis solution. Splunk ITSI uses machine-driven (artificial) intelligence, identifies existing and potential problems, prioritizes the rapid recovery of business-critical services, and provides analytically driven IT operations.
The Splunk Functions at a Glance
Collection and indexing of machine data Real-time event capture, universal indexing, adapter elimination, use of metric data, timestamps for events
Search and verification Real-time search, transaction search, interactive results
Correlation and analysis Machine learning-based AI, correlation of complex events, event annotations, pattern recognition
Visualization and reporting Dashboard creation, report automation
Monitoring and alerting Monitoring of events and KPIs, proactive notifications
Security and administration Encrypted access to data streams, secure user access
Download the PDF here: Visibility with Splunk IT Service Intelligence